Answers · Career switch
Should I quit my high-paying job?
Short answerHow funded you already are matters more than the size of the pay cut. Past roughly 40% funded, moving to lower-paying work you enjoy usually adds a couple of years, not a decade. If spending drops with the lifestyle change, the delay shrinks further.
You’re not really asking about retirement. You’re asking about the tradeoff between money and years of your life. Below: a live calculator, a case study, and the formulas that show what the switch actually costs against your own numbers.
Try it live
Model the switch
Type your real numbers. Set what you save now, what you’d save after the switch, and when you’d make the change. The calculator shows both Optional Dates and the delay.
18%
Funded today
Years to Optional (after switch)
FEB 2046
vs stay-put OCT 2041
Delay: +52 months
Switch happens in
Monthly save drop
-$2K
Delay to Optional
+52 months
Optional Target
$2.00M
A big delay. Consider whether spending drops with the job change — that usually shrinks the gap fast.
Assumes spending stays flat after the switch. If it drops with the lifestyle change, the delay shrinks fast — model that inside the Scenarios Lab.
Assumes a 7% average real return (after inflation) and a 4% withdrawal rate.
Plain-language
What the pay cut actually costs
The delay is proportional to your drop in monthly savings, not to your drop in gross pay. If you save $3,200 a month now and drop to $1,200 in a new role, the calculator adds up the future value of the $2,000 monthly gap and shows how much later that pushes Optional.
Two things soften the blow. First, most lower-paying career changes come with a real spending drop — you don’t need the same lifestyle to work at a nonprofit as you did to grind through investment banking. Second, if you’re already substantially funded, the delay is measured in years, not decades. Compound interest keeps working on your existing balance whether you’re contributing $3,200 or $1,200 or zero.
The high-cost case is when you switch early, save far less, and don’t cut spending. Then the delay compounds against you. Slide the “switch happens in” chip on the calculator to see the trade-off shift.
Worked example
What a real switch costs
Case study — Priya, 39 — product manager to nonprofit
Priya has $360,000 saved across her 401(k), Roth, and brokerage. She saves $3,200 a month in her current tech job and spends about $80,000 a year. She wants to switch to a nonprofit role that pays a lot less, dropping her monthly savings to $1,200. She keeps her spending flat, at least at first.
Balance
$360,000
Save (now)
$3,200
Save (after)
$1,200
Annual spend
$80,000
If Priya stays put: Optional in about 14 years, at age 53.
If she switches in one year: Optional in about 18 years, at age 57 — roughly a 4-year delay. The switch costs Priya four years of “early” Optional. Not a career sentence, but not free.
If she also cuts spending to $60,000: Optional lands even earlier than her stay-put plan — the new role fits the new life, and the target itself drops. That’s a case where switching is unambiguously the better move on the numbers.
The waiting version: if Priya keeps the tech job for five more years and then switches, the delay shrinks to about 2 years. Waiting concentrates the high-earning years where they do the most compounding good. Whether five years of extra grinding is worth it is a different question.
From the app
This decision, inside Project Optional
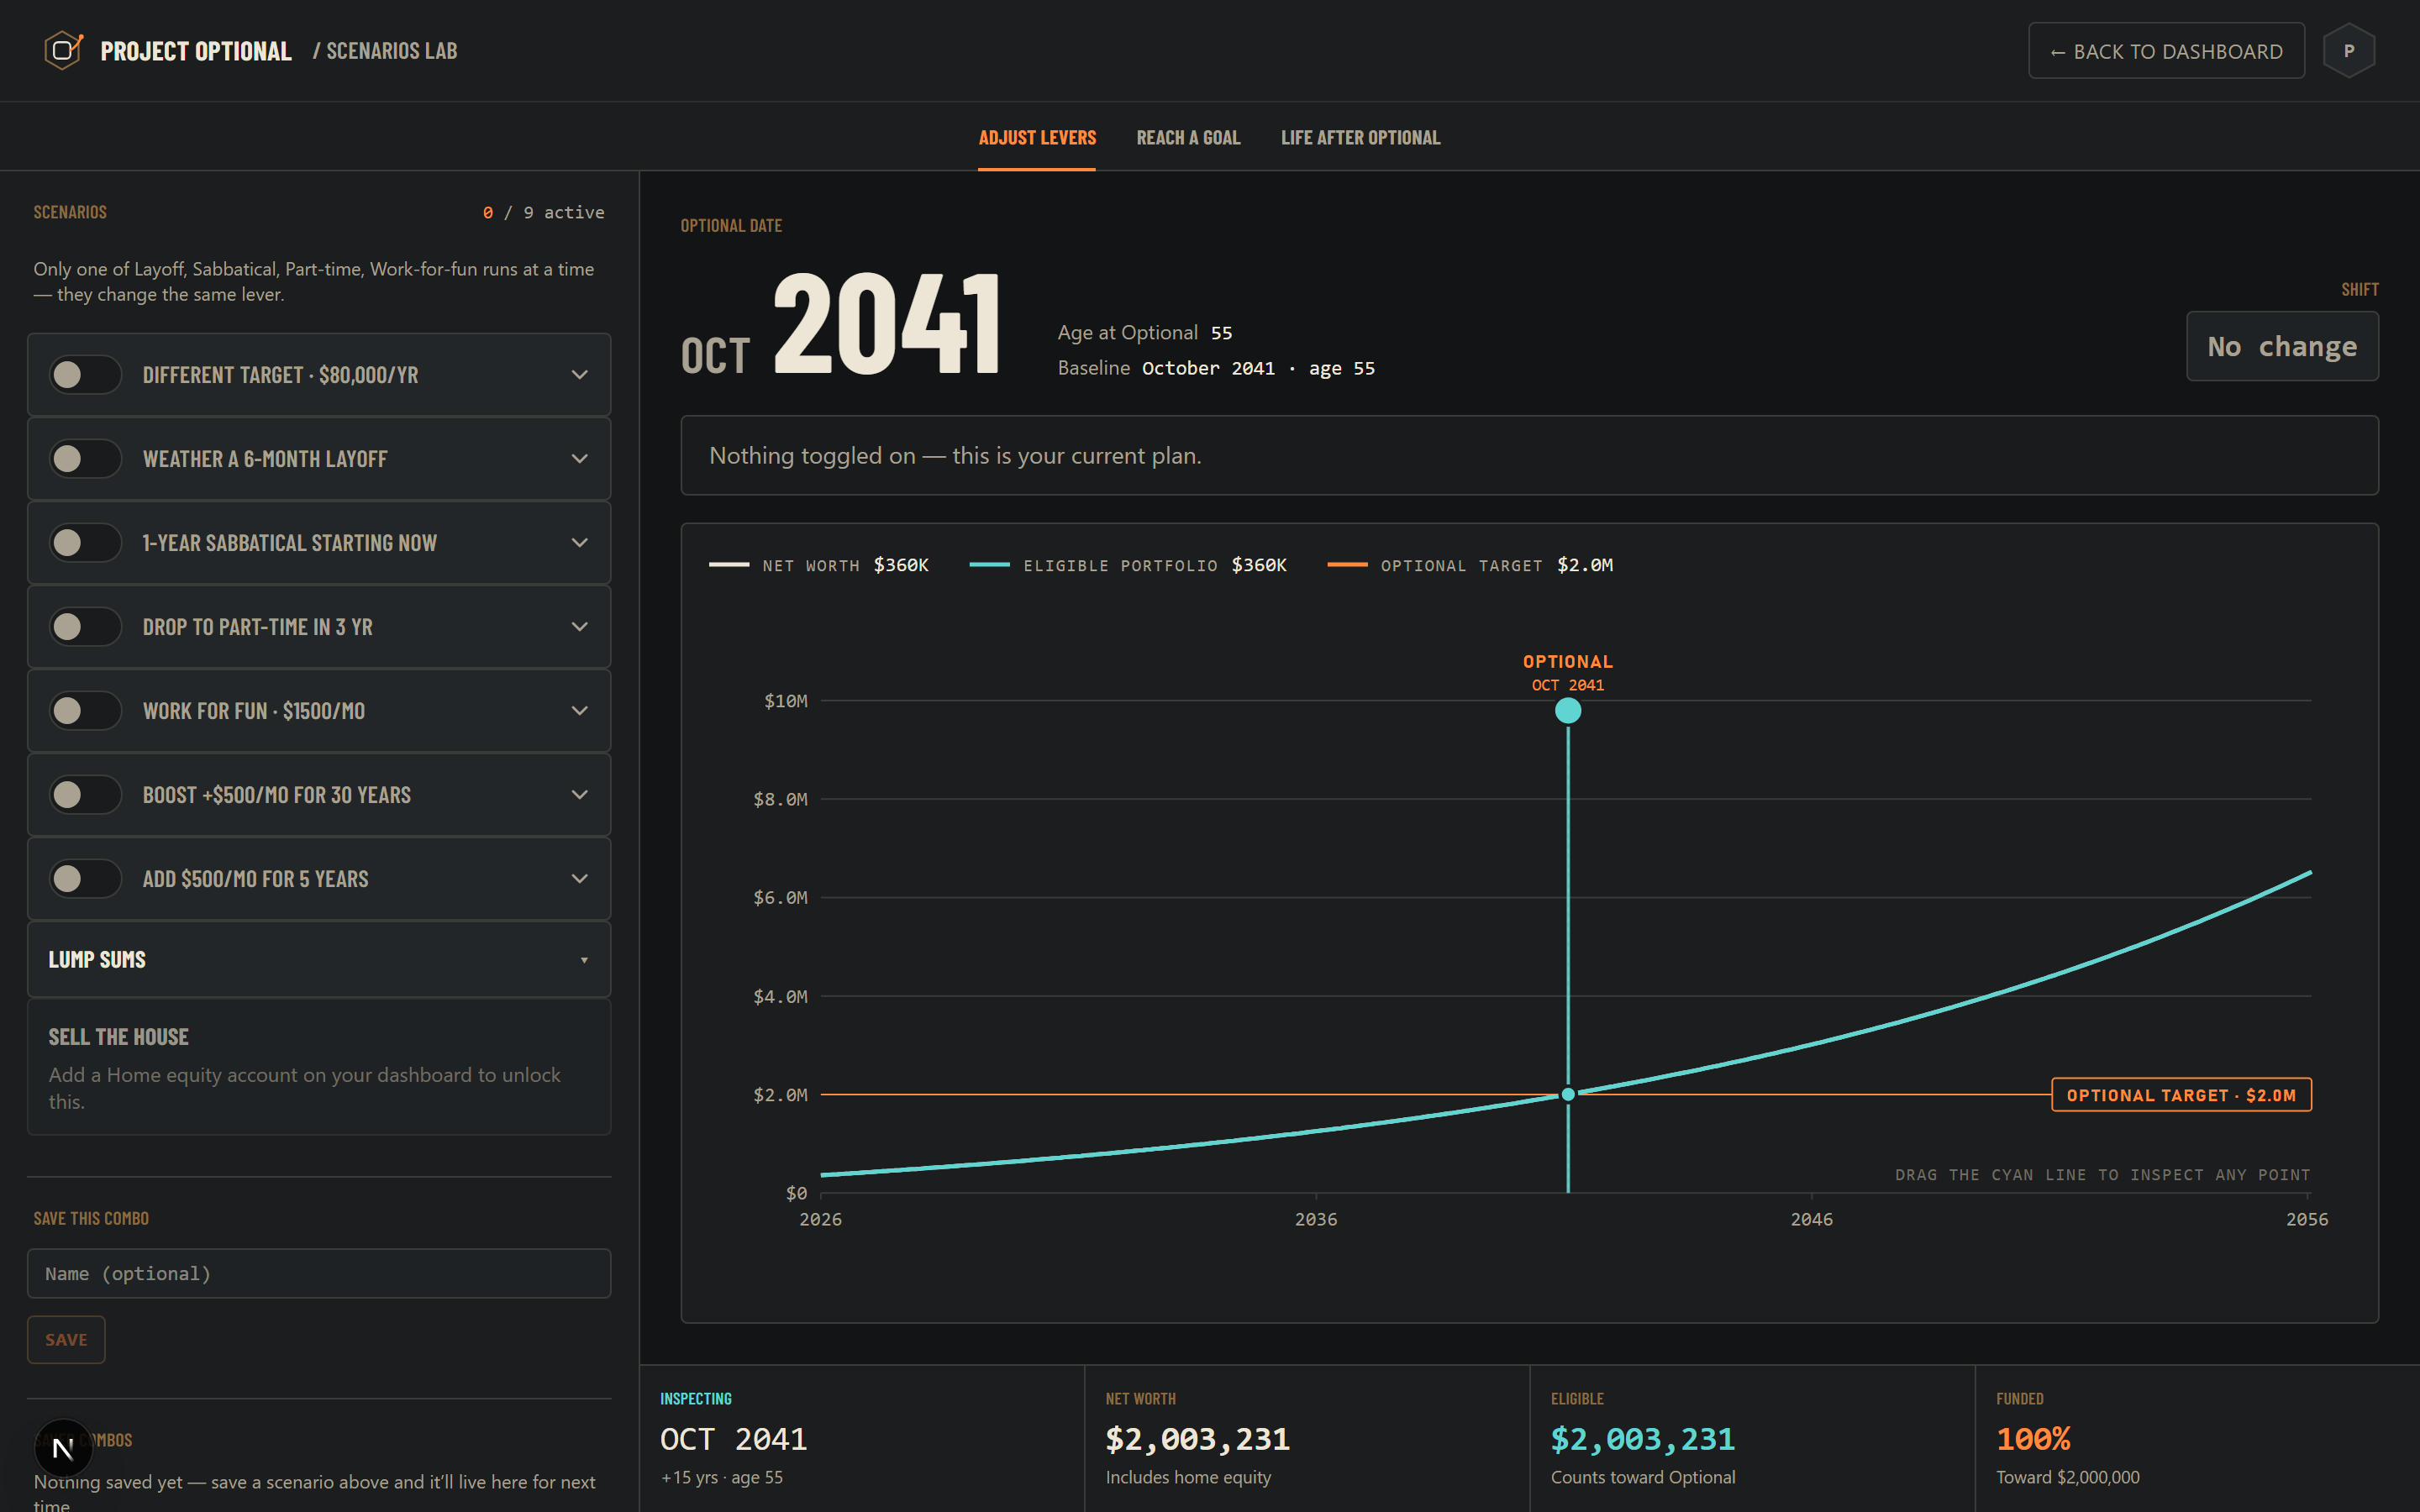
The same math runs live in the Scenarios Lab, alongside every other lever you can pull. Save Priya’s numbers, turn on a spending drop, layer in a sabbatical — every change updates every scenario at once.
Under the hood
Assumptions and formulas
Same engine as the rest of Project Optional. Nothing is hidden.
Optional Number = Annual Spending ÷ 4% = Annual Spending × 25
Each month, your balance grows and then absorbs the current contribution. Before the switch, that’s your current save. After the switch, it’s the new save:
ending balance = starting balance × (1 + monthly return)
+ (before switch ? current save : save after switch)
monthly return = (1 + 7%)^(1÷12) − 1 ≈ 0.565%/month
- 7% average real return. Already inflation-adjusted, so your target stays flat in today’s dollars.
- 4% safe withdrawal rate. Adjustable inside the app; fixed at 4% on this page.
- Spending stays flat after the switch. If it drops with the lifestyle change, the delay shrinks fast — model that inside the Scenarios Lab.
- The switch is one-time. If you plan to switch again later, model it as a Layered scenario in the Lab.
- No taxes on withdrawals. See the Real-life limits section below.
Common questions
What people ask about this
Is there a “you’re safe to switch” threshold? Loosely, yes. Once you’re past about 40% funded, the delay for even a large pay cut is usually measured in a handful of years, not decades. Below 25% funded, a big cut can push Optional out substantially. Neither number is a rule.
What if the new job comes with better health insurance or benefits? That reduces effective spending. Lower spending target = lower Optional Number = closer date. Model the reduction directly by lowering “annual spending” in the calculator.
What if the switch pays more, not less? Then the delay is negative. Move Optional closer. The calculator handles both directions — set “save after switch” higher than “current save” and watch the date pull forward.
Optional vs retirement
Work Optional isn’t the same as retirement.
Retirement says: work until you can afford to stop. Optional says: work until you can afford to choose. The math is the same: enough invested to fund your yearly spending indefinitely. The story around the number is completely different.
At Optional you have flexibility. Stay in the job you like. Drop to part-time. Move to a lower-paying role you’d enjoy more. Take a year off. Start something that pays nothing for its first three years. Or keep working the same job and never touch the money, because you’d rather have the option than the exit.
That’s what “Optional” means in Project Optional. Not a stop date. An unlock date: the day the money side of your life stops requiring the exact job you have now.
Real-life limits, what we don’t model yet
The projection shows growth. It doesn’t yet model the drawdown.
Project Optional projects your investments growing toward the number that funds your yearly spending. Pulling that money out is the last mile, and it has real-world limits worth naming:
- Taxes. Traditional 401(k) and IRA withdrawals are ordinary income (usually 10 to 24%). Taxable brokerage pays capital gains (0 to 15% for most). Roth withdrawals are tax-free once vested. Which account you pull from changes the take-home number, sometimes by a lot.
- Age limits. Traditional accounts carry a 10% penalty on withdrawals before 59½, with narrow exceptions like the Rule of 55 and SEPP. Roth contributions can come out anytime; earnings can’t until 59½ and a five-year hold. If your Optional Date lands before 60, sequencing matters.
- Fees. A 1% expense ratio subtracts a full 1% from your projected 7% real return, and it compounds. Over 30 years, that often eats 20 to 30% of the ending balance.
Tax-aware drawdown sequencing (the “which account do I pull from first” question, with age gates and RMDs baked in) is on the Project Optional roadmap. Today, Optional means enough invested to fund your yearly spending indefinitely. The withdrawal plan comes next.
Ready to run your own numbers?
Save this switch and see it against your real plan
Type your actual numbers into Project Optional, model the switch inside the Scenarios Lab, and stack it against every other decision at once.
Nothing here is advice.
Project Optional is a modeling tool, not a financial advisor. Real markets don’t grow at a smooth 7% every year. Real spending doesn’t stay flat. Real lives have surprises no calculator sees coming. Use what you see here to think through your options, not as a replacement for talking to someone qualified when you’re about to make a big decision.