Answers · Sell the rental
Should I sell my rental and stop working?
Short answerThe question is whether the sale proceeds carry you across your Optional Number. Ongoing rental cash flow is a separate question. Most of the time a clean invested balance beats a slower-compounding rental, but not always.
A rental sale is really two decisions stacked together: give up the monthly income, take the lump-sum proceeds. Below: a live calculator, a case study, and the formulas that compare both paths against your own numbers.
Try it live
Compare keep-vs-sell
Type your real numbers. Set the sale proceeds (after tax and fees), the rental’s net monthly income, and when you’d sell. The calculator shows Optional Dates for both paths and the pull-forward from the sale.
28%
Funded today
Years to Optional (after sale)
FEB 2036
vs keep DEC 2038
Change: 34 months sooner
Sell in
Cash from sale
$320K
Rental income given up (annual)
-$12K
Change to Optional
34 months sooner
A meaningful pull-forward. Selling helps, though not by decades.
Assumes rental income equals the net after mortgage, maintenance, tax, and vacancy. Proceeds are the after-cost-basis number that lands in your brokerage.
Assumes a 7% average real return (after inflation) and a 4% withdrawal rate.
Plain-language
Two effects, running in opposite directions
Selling the rental produces a big one-time lump sum you can invest, which compounds at the market rate. That’s pull-forward on your Optional Date.
Selling the rental also stops the monthly income the property produces, which was shrinking how much you needed the portfolio to cover. That’s push-back on your Optional Date.
Which effect wins depends on two things: the size of the lump sum relative to the annual rental income, and how long you have before Optional. Long horizons favor the sale — compounding on the lump sum dwarfs any rental cash flow. Short horizons closer to Optional often favor keeping the rental, because the ongoing income directly shrinks your target.
Worked example
What the trade looks like
Case study — Marcus, 46 — considering a rental sale
Marcus has $520,000 in his 401(k) and brokerage. He saves $2,000 a month and spends about $75,000 a year. He owns a rental worth $400,000 with $80,000 remaining on the mortgage. After tax, fees, and paying off the mortgage, a sale would net him about $270,000. The rental brings in about $1,000 a month net of every cost.
Balance
$520,000
Monthly save
$2,000
Rental net
$1,000/mo
Sale nets
$270,000
If Marcus keeps the rental: The $1,000/month counts as extra savings toward Optional. On his numbers, Optional lands about 12 years from now, at age 58.
If Marcus sells in one year: The $270,000 lands in his brokerage and compounds. The $1,000/month rental income stops. Optional lands about 10 years from now — roughly 2 years sooner.
If Marcus waits five years to sell: The rental keeps producing income in the meantime, then a smaller relative bump from the sale. Optional lands about the same time as keep — a wash.
The rule of thumb: if the sale proceeds are worth at least 20 times the annual rental income, selling usually accelerates Optional. Marcus’s ratio is 22.5 ($270K / $12K), which is why the sale wins on his numbers.
From the app
This decision, inside Project Optional
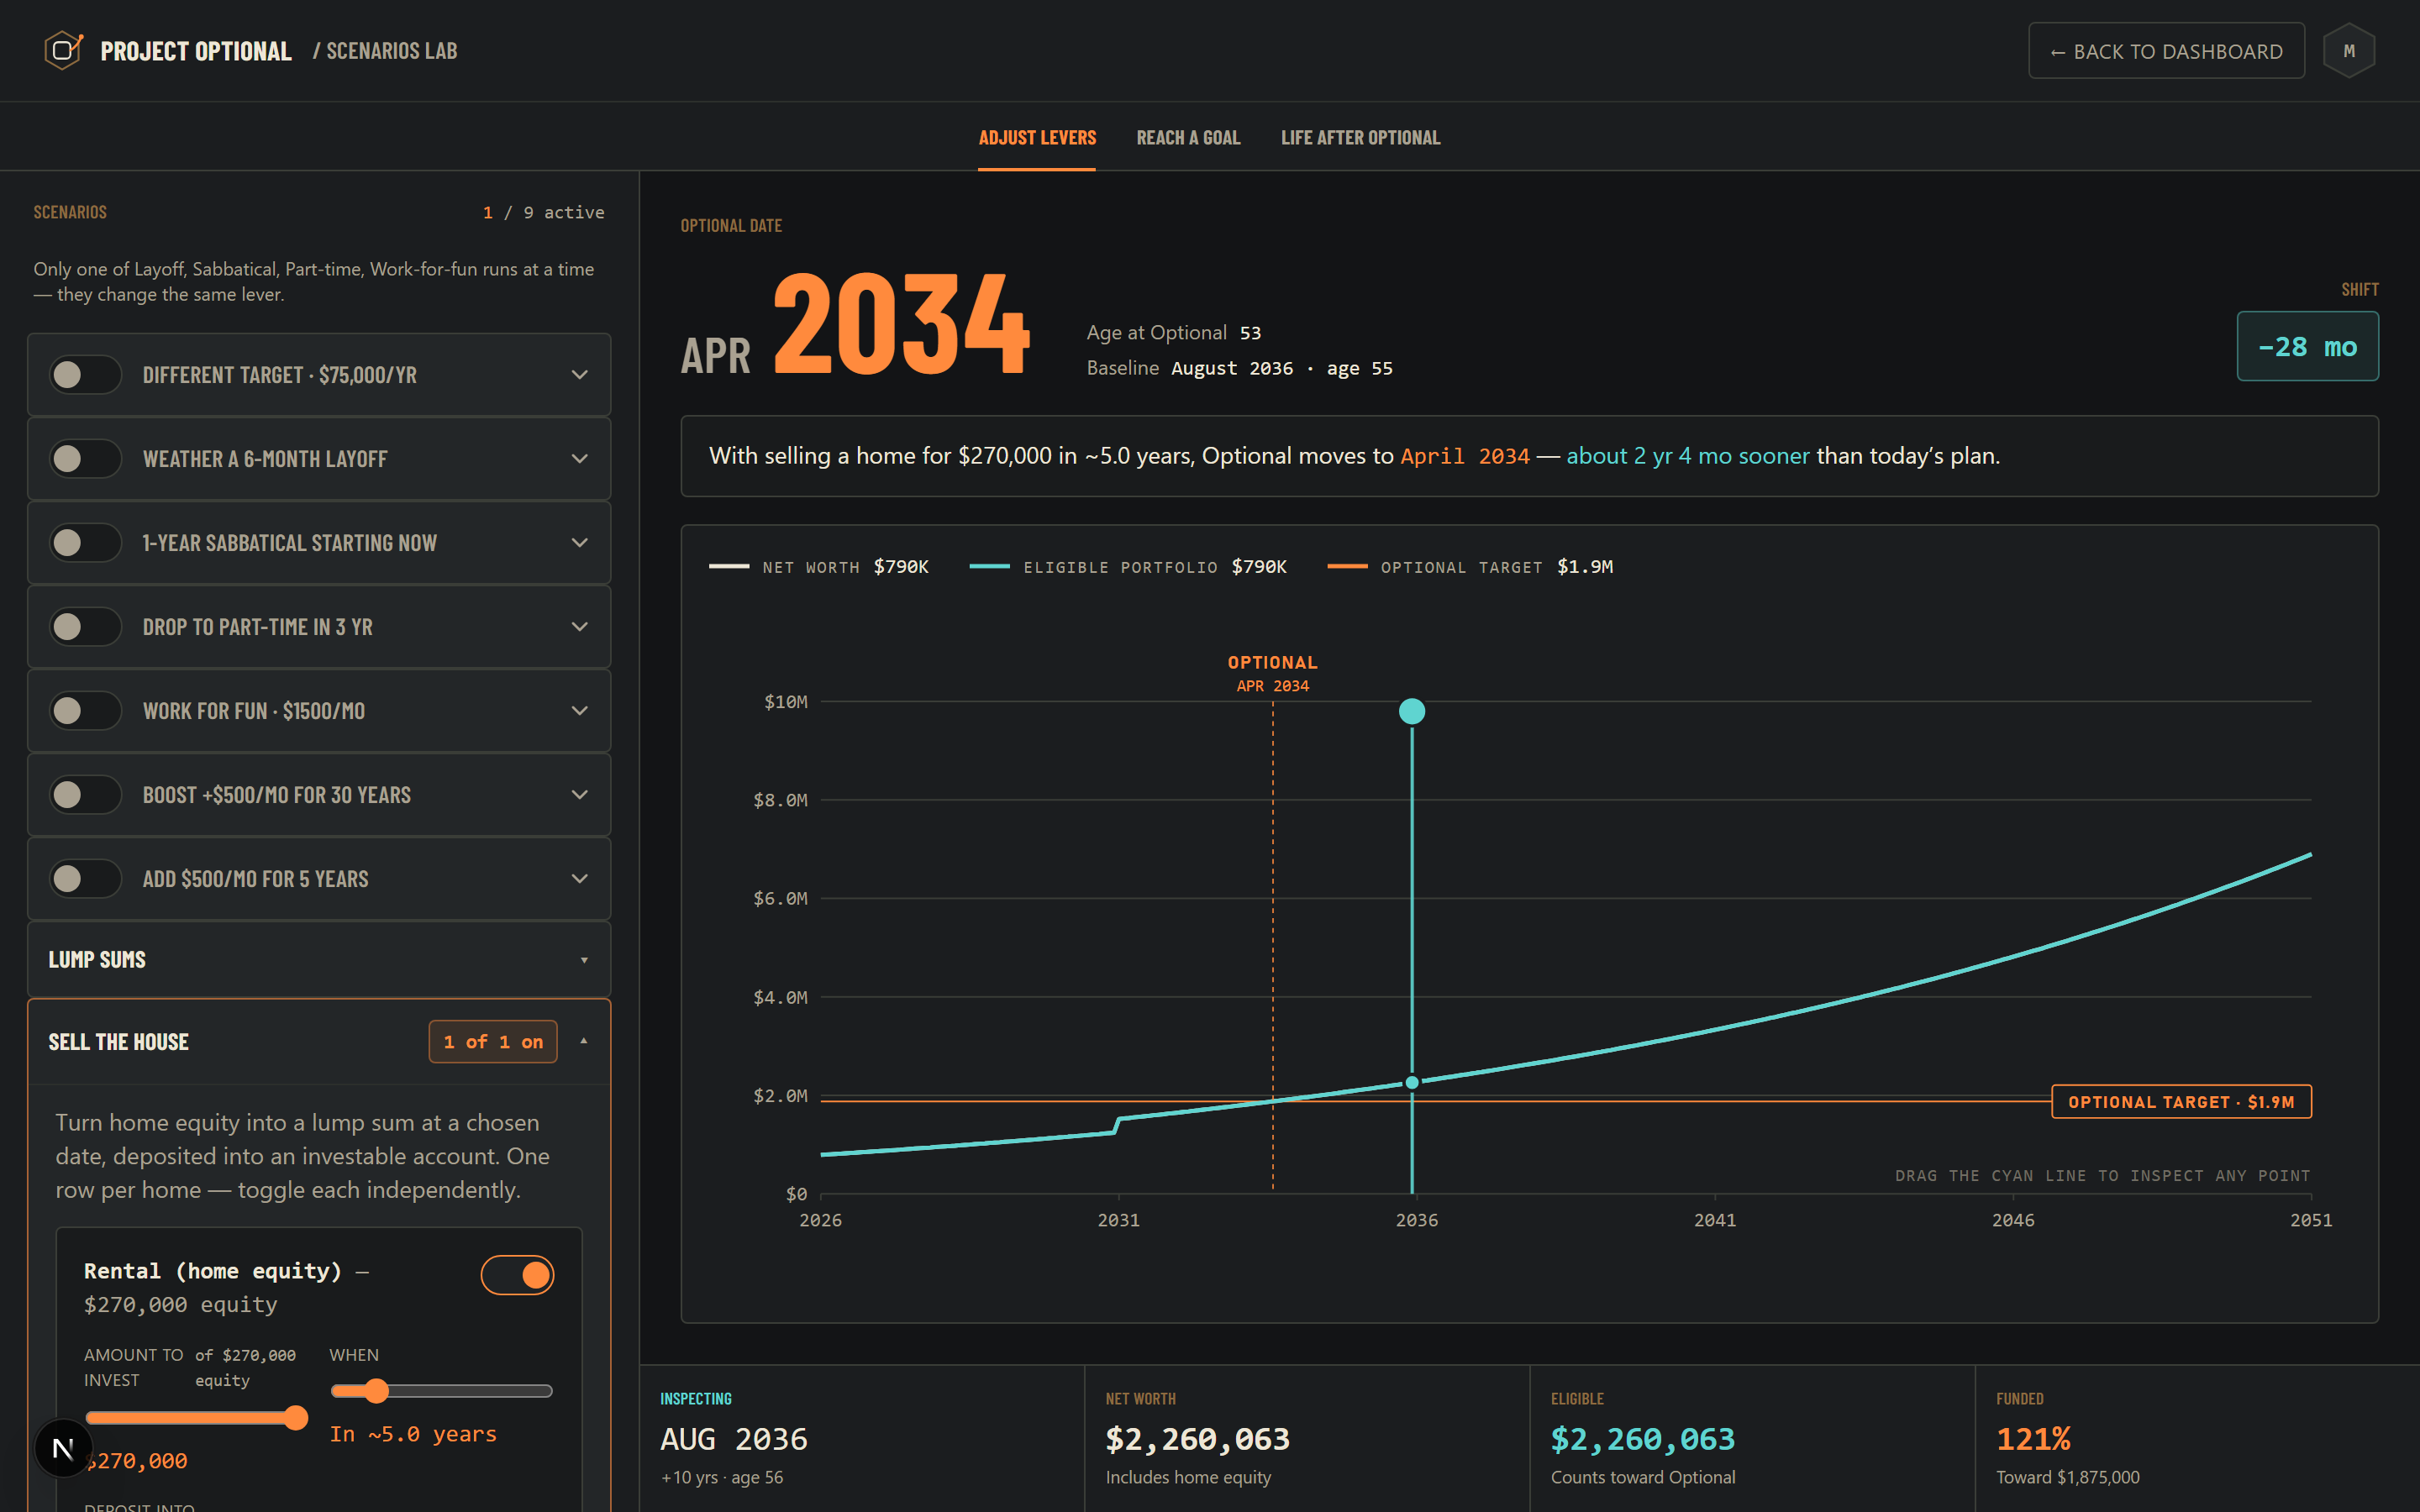
The same math runs live in the Scenarios Lab through the Sell-the-House scenario, which works for any real-estate holding you’d convert to invested principal. Layer it against your other levers to see the combined effect.
Under the hood
Assumptions and formulas
Same engine as the rest of Project Optional. Nothing is hidden.
Optional Number = Annual Spending ÷ 4%
Each month, your balance grows, then absorbs your contribution plus (while you own the rental) the rental’s net income. At the sale month, the proceeds are added as a one-time lump, and rental income stops:
ending balance = starting balance × (1 + monthly return)
+ monthly contribution + (own rental ? net rental income : 0)
+ (sale month ? proceeds : 0)
monthly return = (1 + 7%)^(1÷12) − 1 ≈ 0.565%/month
- Proceeds are after capital gains, depreciation recapture, closing costs, and mortgage payoff. Enter the net.
- Rental net income is after mortgage, maintenance, taxes, insurance, and vacancy. Not the gross rent.
- 7% average real return on the invested proceeds. Real estate appreciation historically runs closer to 1% real, which is why the sale often wins on long horizons.
- No new expenses on the invested side. If selling would force a real-estate replacement (buying a primary residence), model that as a separate cash outflow.
- No taxes on withdrawals. See the Real-life limits section below.
Common questions
What people ask about this
What if the rental appreciates faster than the market? Then keeping it looks better than the model shows. Real estate that appreciates at 5%+ real returns for a decade beats a diversified index. That happens, but it’s not the base rate.
What about a 1031 exchange? The calculator doesn’t model tax-deferred exchanges directly. If you’re rolling into another rental, the “sell” branch above isn’t the right question — you’re not converting to investable cash.
Does landlording effort count? Not in the numbers, but it should count in your decision. Ten years of managing tenants is real. The calculator shows the money side; you weigh the rest.
Optional vs retirement
Work Optional isn’t the same as retirement.
Retirement says: work until you can afford to stop. Optional says: work until you can afford to choose. The math is the same: enough invested to fund your yearly spending indefinitely. The story around the number is completely different.
At Optional you have flexibility. Stay in the job you like. Drop to part-time. Move to a lower-paying role you’d enjoy more. Take a year off. Start something that pays nothing for its first three years. Or keep working the same job and never touch the money, because you’d rather have the option than the exit.
That’s what “Optional” means in Project Optional. Not a stop date. An unlock date: the day the money side of your life stops requiring the exact job you have now.
Real-life limits, what we don’t model yet
The projection shows growth. It doesn’t yet model the drawdown.
Project Optional projects your investments growing toward the number that funds your yearly spending. Pulling that money out is the last mile, and it has real-world limits worth naming:
- Taxes. Traditional 401(k) and IRA withdrawals are ordinary income (usually 10 to 24%). Taxable brokerage pays capital gains (0 to 15% for most). Roth withdrawals are tax-free once vested. Which account you pull from changes the take-home number, sometimes by a lot.
- Age limits. Traditional accounts carry a 10% penalty on withdrawals before 59½, with narrow exceptions like the Rule of 55 and SEPP. Roth contributions can come out anytime; earnings can’t until 59½ and a five-year hold. If your Optional Date lands before 60, sequencing matters.
- Fees. A 1% expense ratio subtracts a full 1% from your projected 7% real return, and it compounds. Over 30 years, that often eats 20 to 30% of the ending balance.
Tax-aware drawdown sequencing (the “which account do I pull from first” question, with age gates and RMDs baked in) is on the Project Optional roadmap. Today, Optional means enough invested to fund your yearly spending indefinitely. The withdrawal plan comes next.
Ready to run your own numbers?
Save this scenario and see it next to your real plan
Type your actual numbers into Project Optional, model the sale inside the Scenarios Lab, and stack it against every other decision at once.
Nothing here is advice.
Project Optional is a modeling tool, not a financial advisor. Real markets don’t grow at a smooth 7% every year. Real spending doesn’t stay flat. Real lives have surprises no calculator sees coming. Use what you see here to think through your options, not as a replacement for talking to someone qualified when you’re about to make a big decision.